Business Consulting Across APAC
We help energy businesses enter, expand and grow across Australia and Asia Pacific. Six markets, six different playbooks — market entry into Vietnam looks nothing like expansion into Singapore. Get the market structure, channel access, pricing and local partners sorted before you commit capital.
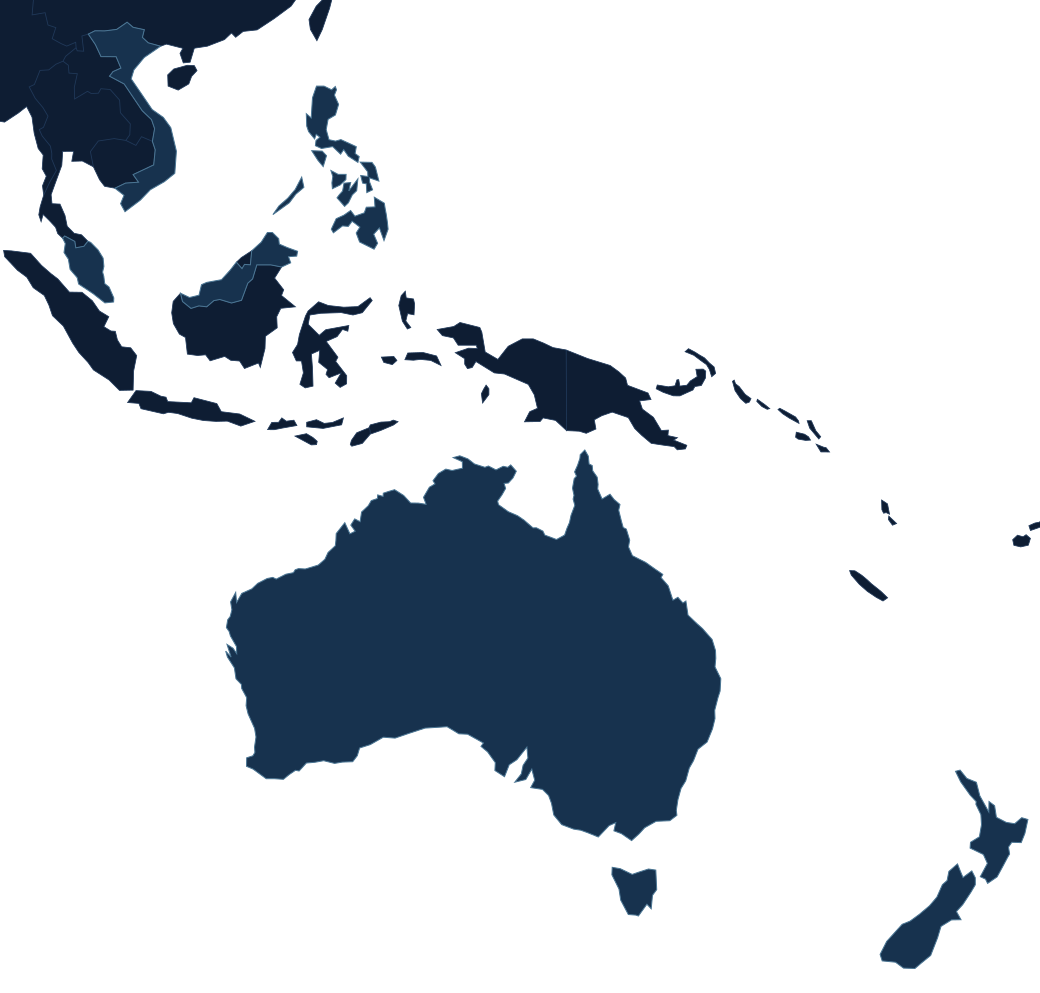
Australia
Renewables share of generation: Clean Energy Council, Clean Energy Australia 2026 (CY2025).
* Market value and CAGR are indicative estimates, not sourced figures.
Growth here doesn’t automatically become margin. Connection risk, channel economics, customer acquisition costs and delivery margins all have to line up — together.
A two-week commercial discovery call on one channel or one delivery-cost line.
- Segment and channel prioritisation
- Install and delivery cost structure
- Agentic AI in sales and customer service
New Zealand
Renewables share of generation: MBIE, Energy in New Zealand 2026 (CY2025).
* Market value and CAGR are indicative estimates, not sourced figures.
A handful of gentailers set the terms of trade here. Entry economics turn on which channel you can actually reach and at what cost — not on total demand — and the addressable slice is usually narrower than the headline number suggests.
A market-entry read on addressable segment and route to market.
- Entry and partner-model assessment
- Channel access and route-to-market mapping
- Pricing against gentailer benchmarks
Singapore
Renewables share of generation: derived from EMA/MTI — about 95% of generation is imported natural gas; confirm against Singapore Energy Statistics.
* Market value and CAGR are indicative estimates, not sourced figures.
Land constraint puts the value in rooftop, imports and how the regional entity is structured — not in installed volume. Most decisions here are capital and structuring decisions wearing an energy label.
A structuring review across the regional entity and the C&I pipeline.
- Regional entity and structuring assessment
- Commercial and industrial rooftop economics
- Import and offtake evaluation
Philippines
Renewables share of generation: Department of Energy — 28,193 GWh of 126,941 GWh (2025).
* Market value and CAGR are indicative estimates, not sourced figures.
Winning work is not the constraint. Staffing and costing delivery to a contracted margin is, because the pipeline is growing faster than the qualified delivery base and cost assumptions written at bid stage rarely survive mobilisation.
A cost-to-serve and delivery capacity discovery call on one active programme.
- Delivery capacity and cost-to-serve modelling
- Offshore back-office and BPO design
- Local partner and EPC selection
Malaysia
Renewables share of generation: Ember, April 2026 — fossil 79%, solar and wind 2%.
* Market value and CAGR are indicative estimates, not sourced figures.
Demand arrives in programme rounds and corporate PPAs, so timing and eligibility decide returns more than price does. Bidding into the wrong round with the right number is the most common way margin is lost.
A bid positioning review against the current programme round.
- Scheme and tender positioning
- Corporate PPA demand sizing
- Local content and partner structuring
Vietnam
Renewables share of generation: Ember, April 2026 — fossil 55%, solar and wind 12%.
* Market value and CAGR are indicative estimates, not sourced figures.
The largest installed base in Southeast Asia and the least settled commercial framework around it. Bankability, PPA terms and curtailment risk decide whether volume becomes return, and they move faster than most entry theses are updated.
A bankability and offtake risk read on one asset or one entry thesis.
- PPA and offtake risk assessment
- Curtailment and revenue modelling
- Entry sequencing and partner diligence
Indonesia, Thailand, Japan and Korea sit outside our current coverage. If your decision touches them, or sits with a network, OEM or financier across several of these markets, the discovery call still applies.
Australia-Led. APAC When the Economics Make Sense.
Australian businesses expand into APAC by starting with a commercial read of the market, not a country checklist. We run six markets through the same lens — Australia, New Zealand, Singapore, the Philippines, Malaysia and Vietnam — and Australia is where we deliver most of our work, which gives us a real benchmark for judging the other five.
Every APAC market runs on different customers, channels, competitors, regulations, cost structures and risk. What should you consider when entering an APAC market? Eight questions, answered before capital moves: which markets to prioritise, whether addressable demand justifies entry, what route to market will actually work, who the right local partners are, what to charge, what it costs to serve customers locally, what operational capability you need, and what could break the business case.
Which APAC markets offer the fastest growth? Vietnam (16% CAGR to 2030) and the Philippines (14%) are outpacing the region; Singapore (8%) is the slowest but carries the most regional capital and structuring weight. Our role is to find where your business has a genuine right to win in APAC market expansion — then work out how to enter, operate and grow it profitably.

Start with a Discovery Call.
One call. We assess the market opportunity, flag the commercial issues that matter and point to the strongest path to growth — before you commit capital or resources.